Tableau Talk: Calculated Fields
Listen, I’m just going to go ahead and say it – I have a thing for celebrities named Justin. Justin Beiber, Justin Timberlake, even Canadian Prime Minister Justin Trudeau – what can I say, I have a type. Luckily for me, I can find out what these J-named gentlemen are up to online whenever I want, thanks to my favorite data set: which Justin posted that. Today, I’ll be combining my love of celebs with my love for Tableau and introducing you all to calculated fields and calculations, which are some of the most powerful features of this tool.
So, why do we use calculated fields (sometimes referred to as CFs)?
Let’s say your underlying data doesn’t include all the fields you need to answer your questions. You can create new fields in Tableau from the existing ones using calculations and save those fields as part of your data source. These fields are called calculated fields. These fields are versatile, can be used with any sort of data type, different functions, aggregations, and logical operators.
The advantages of using calculated fields include segmenting data quickly, getting rid of unwanted results for better analysis and understanding of data, leveraging the power of the Tableau parameters, as well as saving unwanted database processing and storage resources by using different calculations across many different levels.
Types of Calculations
CFs are created using calculations. However, the type of calculation you’d use would depend on the needs of your analysis and the questions you want to answer.
There are three main types of calculations in Tableau:
Basic Calculations: You can transform values or members at the data source level (row-level calculation) or at the visualization level of detail (an aggregate calculation).
Level of Detail (LOD) Expressions: These calculations are like Basic Calculations, but they give you even more control over the level of granularity you want to compute, such as;
- Include – more granular level
- Exclude – less granular level
- Fixed – completely independent level
Table Calculations: These calculations allow you to transform values at the level of detail of the visualization only.
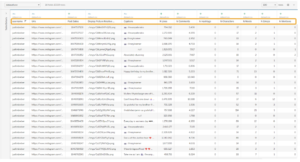
Now that we know what CFs are, let’s create a few calculated fields.Consider the dataset below depicting information on Instagram posts made by a handful of celebrity Justins.
I want to analyze the data and discover some fun hidden insights. First, I begin by comparing the number of likes and comments that each of the Justins received.
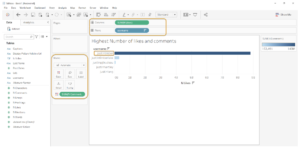
The chart seems fine but what I don’t like is that the name “Justin” keeps repeating for every value in the axis, eg, “justinbeiber”, “justintimberlake” etc. This is because the values for the username column are arranged in a format that doesn’t include spaces and it contains the first and the last names combined.
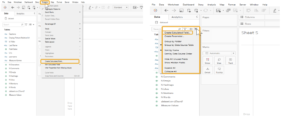
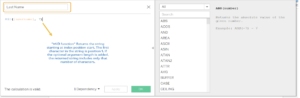
I think I’d like it better if I only had the last names on the axis, since the first name is common for all. Unfortunately, since I don’t have first and last name columns in my dataset, I must create them using string functions. To do this, I’ll need to create a calculated field called “Last Name” and will use it in my view. This is done by selecting either the Analysis Menu > Create a Calculated field or the dropdown arrow in the data pane and select create a calculated field.
In the create calculated field window the formula is as follows, where [username] field is the input to my function.
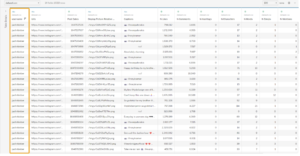
When I place my newly created calculated field in the view this is what I got:
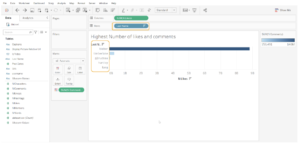
Looks much better, right? It seems like Bieber gets the greatest number of likes and comments followed by Trudeau. Lets go deeper and look at a couple of other charts I built to compare the percentage of hashtags used by each Justin:
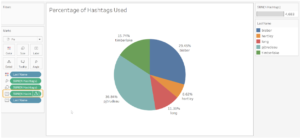
It looks like the Canadian public figures Trudeau and Bieber lead the numbers here as well. However, I want you to focus on the delta (triangle) symbol beside the label field “SUM(N Hashtags)”. It appears on the field to indicate that a quick table calculation has been applied to it. All I did was add the field to label under marks card > right click on the field and add a percent of total table calculation.
Alright, now let’s say I want to know the minimum number of words used by each of our Justins in their captions, this is where I can use a LOD Calculation, with a formula defined as shown below:
When you create and save an LOD, Tableau adds it to either the Dimensions or Measures area in the Data pane. You can also edit your calculated field by right clicking on it and choose to edit (also shown in the gif above).
Now, Let’s assume we have a hierarchy that follows the structure username > Captions, and I want to calculate what the minimum number of word(s) used by a Justin for their captions. All I must do is place my dimension and the measure (here, it’s the LOD Calculated field- Minimum words used) on rows & columns shelves.
Let’s look at that in action:
As you can see, the hierarchy-dimension field has been placed in the Rows shelf and the calculated field. Additionally, the measures are placed on text which creates a crosstab. However, what I want you to focus on in the gif above is that the values in the Calculated field column remain the same even if you drill up or down on the Dimension – Hierarchy field. This is because of the FIXED LOD calculation. FIXED level of detail expressions can have a greater level of detail than the view, a coarser level of detail, or the same level of detail. The need to aggregate the results of a FIXED level of detail depends on what dimensions are in the view.
We can see that all the Justins but Justin Long have a minimum value of 0 (which could mean that they’ve probably used an emoji and no words in some of their captions therefore the zero), but I wonder what the post was which Long has captioned with just one word?
If you apply aggregation to a LOD expression when you create it, Tableau will use the aggregation you specified rather than assigning one when any calculation including that expression is placed on a shelf. However, when no aggregation is needed (because the expression’s level of detail is coarser than the view’s), the aggregation you specified will be ignored but it still will be shown when the expression is on a shelf.
Well, that concludes this topic. Please feel free to reach out to me by email or via LinkedIn, I’d love to know your thoughts and answer any questions!