Computer Vision and Auto ML – DataRobot Visual AI Demo
In Part 1, we discussed computer vision, a field of science that refers to the ability of a computer to understand images and make decisions based on that information. We explored where this technology is used, its ability to outperform the human visual system, and the common barriers to entry that engineers face. Finally, we introduced automated machine learning platforms, like DataRobot, that allow us to start leveraging image data in our models without needing to be computer vision experts.
Building a Classification Model with DataRobot Visual AI
Requirements:
- The latest version of Google Chrome. Other browsers such as Edge, Firefox, and Safari are not fully supported and may not work as expected. Please note that ad block browser extensions may cause display or performance issues in the DataRobot web app.
- DataRobot AI Cloud Platform account. You can sign up for the trial version for free. All features used in this tutorial are available in the trial version.
- Download the flower_data_extension dataset from Kaggle. This dataset contains 1680 images belonging to 10 different classes to train a simple flower classification model.
Let’s Get Started
1. Create an image-processing ready dataset.
The Visual AI workflow can be broken down into just a few steps. When creating projects with Visual AI, data is provided to DataRobot in a ZIP archive. There are two methods for identifying image locations within the archive:
- Using a CSV file that contains paths to images (See Figures 1 and 2).
- Using one folder for each image class and file-system folder names as image labels (works for a single-image feature classification dataset).
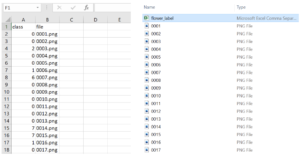 Figure 1 – CSV file that contains the paths to the images. Figure 2 – Our folder containing the csv and image files.
2. Create projects from the AI Catalog or via local file upload.
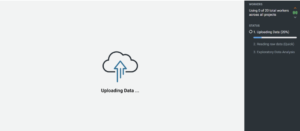 Figure 3 – Uploading data to DataRobot. See the steps performed by DataRobot under “status”.
Once created, you can share and preview the dataset in the AI Catalog, import from a data source, or select a local file. As the dataset is being loaded, DataRobot automatically performs all the initial data exploration steps that a data scientist would typically follow, like calculating the means and distributions of our attributes. This gives us an understanding of the dataset, prior to model training.
3. Preview images for potential data quality issues.
Once the dataset has been loaded and undergone the initial exploratory analysis, we can see some summary statistics about our variables. We can also explore each one individually and visually inspect our attributes and identify any data quality issues.
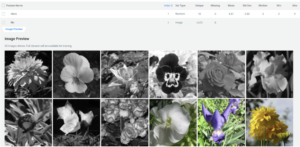
Figure 4 – Image Preview and summary statistics from initial data exploration.
4. Build models using the standard DataRobot workflow.
From there, building and training a model is as simple as selecting our target field (called “class” in our case) and hitting the start button. Once we’ve hit the button, you can check the status to follow what DataRobot is doing in real time. For our project it is creating the cross-validation and holdout partitions as well as characterizing the target variable (see Figure 5). It’s also going to carry out some more in-depth exploratory data analysis to look for outliers and target leakage.
Once this is completed, DataRobot is going to start building predictive models. As pictured in Figure 6, DataRobot is now accessing its large repository of open source and proprietary packages and is going to try out various modeling techniques, without any additional action required on our part. The models that do best will survive the first round and be fed more data. The models that do well from that group will get fed even more data and so on. Ultimately, only the best algorithms to solve our specific problem and dataset will survive.
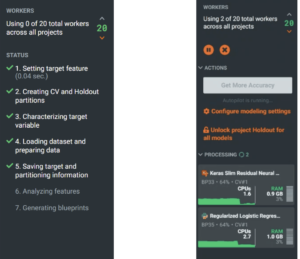 Figure 5 – DataRobot performs some additional preprocessing. Figure 6 – DataRobot training and evaluating various models.
5. Review the data after building.
One of the ways that DataRobot builds trust into its models is through performing a data quality assessment. Below we can see that some missing images were detected. Otherwise, the data looks good.
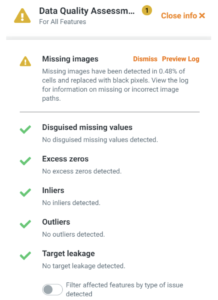
Figure 7 – DataRobot has performed a data quality assessment to identify potential issues within the dataset.
6. Evaluate models on the Leaderboard.
From the model leaderboard, we can see a number of different kinds of models. DataRobot leverages the open source community to access the best algorithms, then adds in all the data science best practices. In our instance, DataRobot built 6 models in total, ranked them, and the winner is the Keras Slim Residual Neural Network Classifier, as seen below.
 Figure 8 – The DataRobot leaderboard shows all the models that were generated. The best model appears at the top.
If we open the model, we can see the blueprint. This shows all the preprocessing steps involved to get the data ready for this model:
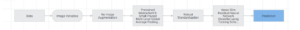 Figure 8 – The DataRobot leaderboard shows all the models that were generated. The best model appears at the top.
Our blueprint is pretty simple. We can see that some average pooling and standardization was performed but no image augmentation or post processing. If you want more information on a specific step that was performed, all you have to do is click on the box in the blueprint and follow the link to the documentation found there to find out what was done and which parameters were adjusted.
Activation maps, which highlight the parts of the image that the model used to make predictions, give us a way to ensure that our model is focusing on the flowers and not the background elements of our images (See below).
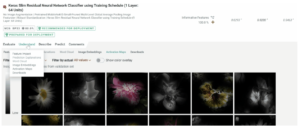 Figure 10 – Activation maps for our flower image data.
DataRobot provides two different views of the activation maps: black and white, and full color. You will want to choose whichever view provides the highest contrast. For the black and white flower images in our dataset, the alternative color overlay may make the activation areas more obvious. This can be changed by clicking the “Show color overlay” toggle button. Left of the images, the high-to-low activation scale indicates how much of a region in an image is influencing the prediction.
Image embeddings allow us to see projections of our images in different groupings. This allows us to visually check what DataRobot sees as being similar and helps us to identify outliers in our image data.
 Figure 11 – DataRobot’s Image Embeddings feature projects the high dimensional image space onto a 2 dimensional space.
Lastly, under the Evaluation tab, we also have access to all the standard DataRobot insights for each model (Confusion Matrix, Feature Impact, and Lift Chart, for example).
 Figure 12 – Confusion matrix depicting the proportion of correct classifications for the multi-class model.
Together, these features allow us to understand and explain the decisions that DataRobot is making, resulting in a model that is transparent and trusted.
7. Fine-tune model parameters for higher or lower granularity or to use a different featurizer.
You also have the option to adjust your model parameters under the advanced options tab. If you don’t have enough images for your dataset, you have the option to create new training images from your dataset by randomly transforming existing images, thereby increasing the size of the training data- this is called image augmentation. This allows you to build computer vision models from datasets that might otherwise contain too few images within a particular class.
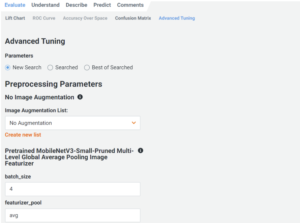 Figure 13 – The advanced tuning options for our model. This includes the option to perform image augmentation.
8. Select a model to use for making predictions via Make Predictions, the DataRobot API, or batch predictions.
Once you’re satisfied with your model, you can deploy right from within the DataRobot platform in a number of ways including batch predictions, weekly scoring jobs, or in real time via an API. When you create a deployment object, you unlock the functionality of DataRobot MLOps. This allows you to monitor and replace your deployments, and compare your current champion model with potential challengers. You’ll be able to keep an eye on service health, data drift, and accuracy. You can even set up notifications that will alert you when your deployment needs attention, so we’re able to know about the status and security of our models without having to spend time checking up on them every day.
Conclusion
Computer vision is a field that seeks to understand and interpret images to automate or outperform the human eye on vision-based tasks. The typical approach to building a computer vision system from scratch generally requires a combination of theoretical knowledge and technical skill. However, the centrality and time saved by automated approaches to machine learning and computer vision make it a useful tool for both the expert engineer and the absolute beginner alike. Using DataRobot, we were able to explore, build, and train a multi-class image classification model. Datarobot also allowed us to understand and evaluate our model to ensure that its predictions can be trusted. Best of all, the entire workflow came together in a matter of minutes.
Key Takeaways:
- Your image data could be an untapped resource with a wide variety of potential applications
- You don’t need to be a computer vision expert to start leveraging your image data
- Automated ML platforms like DataRobot make image data as simple as any other data type by offering:
- Better models from more data perspectives
- Accurate computer vision models with fewer images and less effort
- Explainable decisions with full transparency
- No GPUs necessary 🙂