IBM Cognos License Changes
New IBM Planning Analytics (TM1) Training Modules
What’s New in IBM Cognos 10.2.2
IBM Cognos’ latest release brought with it a number of improvements for the end user. Newcomp BI Practice Lead, Filip Drascovic highlights the “Top Three” improvements within the latest release of IBM Cognos 10.2.2 as being the following:
1. My Data Sets
My Data Sets allows users to quickly upload and easily model personal data sources for end-to-end analysis. Users can manage uploaded files with help from IT, allowing users to be more self-sufficient and allowing IT to focus on other priorities. To maintain security, however, administrators can define who has privileges. Users can use CSV, XLS or XLSX to create reports and dashboards. It can also be used for report authoring and interactive analysis.
2. Targeted Profiles
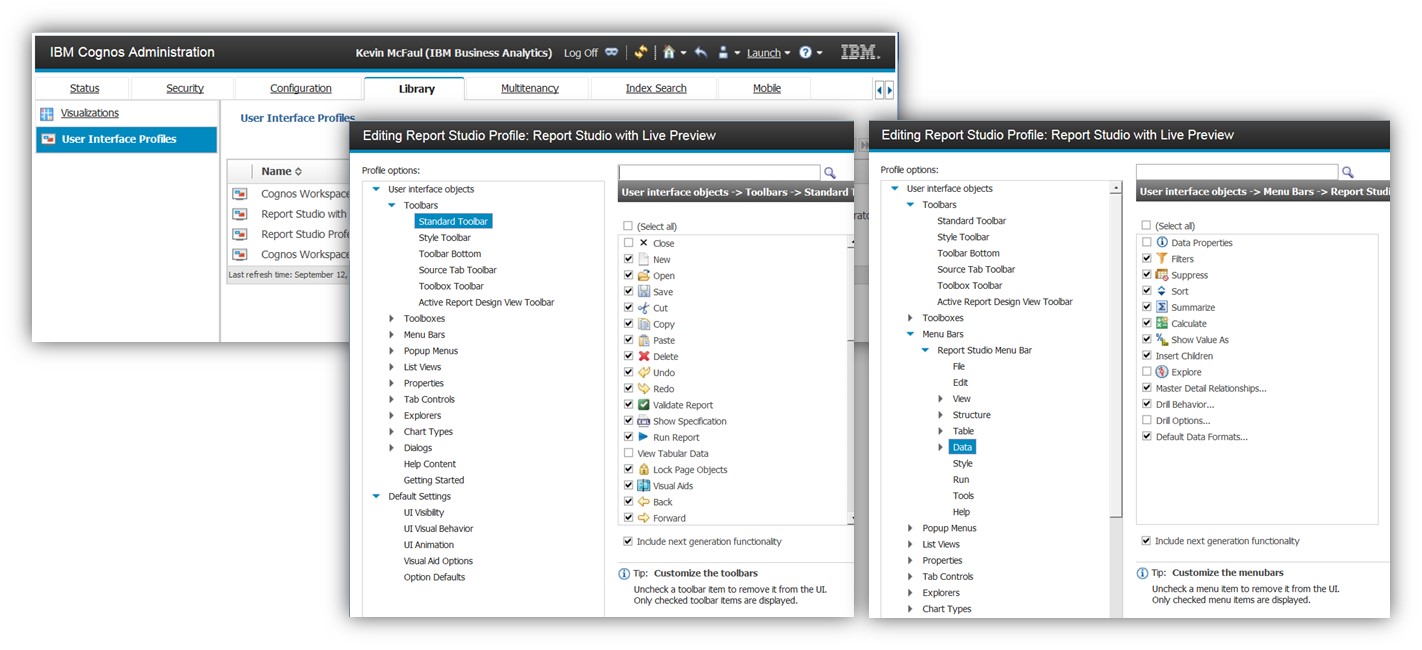
Targeted Profiles are designed to engage more users and make them more self-sufficient. Profiles can be customized for Report Studio and Workplace Advanced. The views are based on skill and required functionality.
3. New Visualizations
New visualization options are available in AnalyticsZone. These new visualizations include Chord, Combination and Tornado. In addition to the new visualizations, extensible visualization properties are exposed in Report Studio and Workplace Advanced. This allows the report author to convert extensible visualizations from one type to another and allowing them to modify chart types in the report without reauthoring. Report Studio also now provides a framework for modifying visualization properties. This allows report authors to modify properties such as chart titles, fonts and axes without having to customize or create a new one.
If you would like to see the full presentation which includes demos of Filip’s Top Three as well as an overview of other new features, please join us on April 2nd at 11:30am EST as we host “What’s New in Cognos 10.2.2” Webinar. You will also have an opportunity to ask questions during the webinar. If you would like more information sooner, please contact us and we would be happy to go over the changes with you directly.
If you would like more information on the webinars we host including License Changes on March 25th or live events including workshops, please provide us with your email address and we will ensure you do not miss an invite.


