
Multi-Layer Mapping in Tableau: Finding The Best of Fall Foliage in Toronto
Planning for Analytics at your Organization
How Amazon Uses Data Science to Package Products
Imagine the types of items shipped by Amazon every day, and the possible corresponding shapes, sizes, weight, fragility of those products. You have probably received an Amazon package with superfluous packing bubbles, in a much larger box than was necessary. That packaging is recommended by an elaborate model developed by Amazon’s data science team, balancing shipping costs with the cost of returns for damaged products.
To get data sciencey on you, the challenges with this problem are a couple of key things:
Ground truth: most items are only shipped in one or two package types and damage is a rare occurrence
Ordinality: Damage is more acceptable on less expensive options vs. higher-cost options.
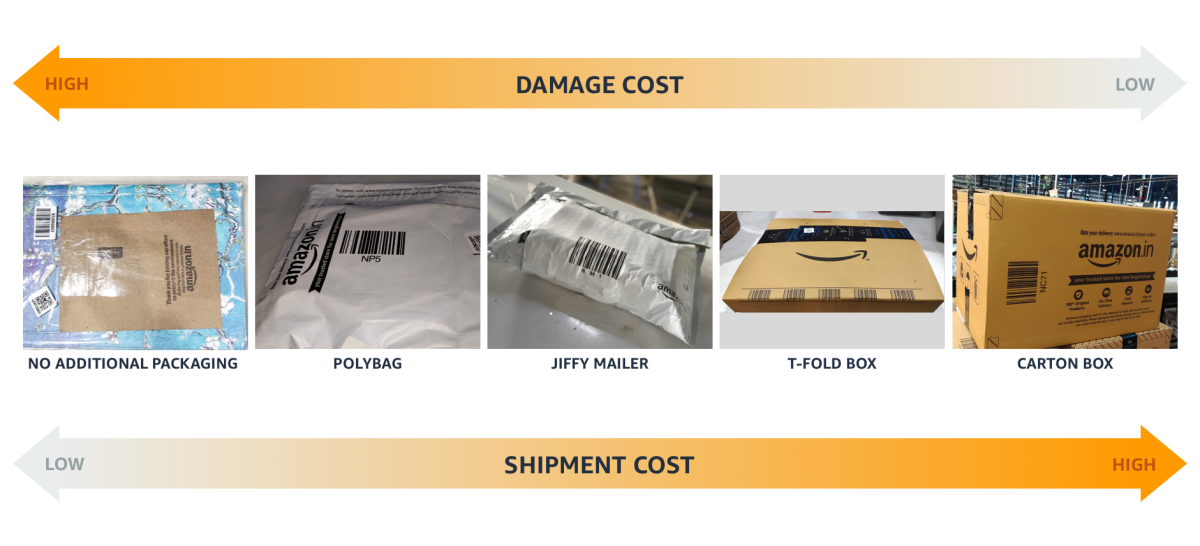
CREDIT: GLYNIS CONDON
The goal for Amazon (and for anyone else doing this kind of optimization) is to find a function that elevates the product features & packaging types that minimize the shipping costs and damage costs, at a very low (product) level of granularity (i.e. very computationally heavy). At first glance, this appears to be somewhat of a typical optimization problem, but there are nuances to consider. For example, the model has to concurrently keep the total cumulative damage across all products below a determined target.
The approach detailed in Amazon’s article explains why a linear model is best suited for both the ordinality problem and for computational efficiency; and critically, by combining this with a weight computation using binary search, equivalence can be proven.
For those of you who are not in the packaging optimization domain – can you think of other ways this could be applied? Customer retention, marketing models, menu optimization, project management. Share your optimization stories with us!
WRITTEN BY:
 |
CHRIS FOSTER, ANALYTICS PRACTICE LEAD
|
Chris Foster is responsible for spearheading the data science, AI and open source practice at Newcomp Analytics. Based in our Calgary office, Chris leads a team of analytics consultants on some of our more advanced analytics implementations. Chris isn’t afraid to roll up his sleeves, and is often found designing modern analytics architectures, developing machine learning models, and coaching executives in his analytics bootcamps.
Read more posts from our blog


