Tableau Talk: Row Level Security
Row Level Security in Tableau refers to restricting the amount of information (rows of data) a user can see in a particular data source or workbook. Subsequently, we have permissions in Tableau Server (or online) that are used to control how the users interact with content.
Let’s look at that in a couple of scenarios:
Example 1: Let’s say we’ve created a results dashboard for a class of 15 students and 3 teachers who teach 3 different subjects – math, science, and literature. We want the students to view their results on the dashboard without the ability to filter data, subscribe, comment on, etc. We can achieve this by setting up permissions on Tableau that limit how students interact with data.
Example 2: Let’s consider the class example again, but this time we are looking at limiting the information that teachers or students can see on a dashboard. We want teachers to look at the results of their respective subject only. As such, we can use Row Level Security in Tableau to allow multiple users viewing the same workbook to see the same dashboards populated with different sets of data (math teacher will have access to math results exclusively, science teacher will have access to science results exclusively, and so on).
In simplest terms, when you publish workbooks in Tableau in order to share your work with others in your organization, by default all users who have access to the workbooks can see all data shown in the views. We can override this by applying a filter to the workbook that enables us to narrow down which specific data (rows) any given person signed into the server can see in the view. The approach of securing the data at the row level can be applied to data sources with live connections and extract data sources whose tables are stored as multiple tables.
There are two ways to apply Row Level Security on your data – by creating a user filter to manually map users to values, or by creating a dynamic filter by using a security field in the data. Let’s dive in and learn how to do both!
Create a user filter and map users to values manually
This method is ideal if you have a fairly small and static set of users or groups to manage, and only a small number of workbooks that need user filters. Begin by opening a new or existing workbook, connect to the data source you would like to filter, and navigate to the worksheet you want to apply a filter to.
- Click Server > Create User Filter.
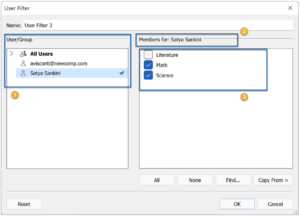
- In the User Filter Dialog box, type a name for the set of rules you are creating.
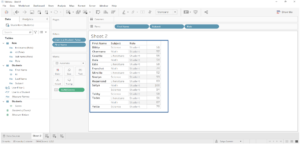
We’ll use the subjects for each student. - Select a user or group from the list on the left. On the right, select the individual members of the field you selected earlier. Here, it’s a subject that a student takes, and you want them to view everyone’s scores for those two subjects.
- In this example, we have the user Satya Sankini who studies math and science at school, so in the Field Member List, you would select Math and Science.
- You will have to repeat the process for each user or group that you’d like to configure and click OK when you’re done mapping users to values.
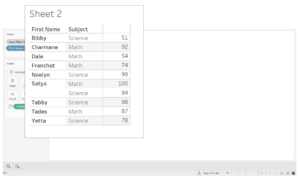
- Once the filter is created, it appears in the Sets area of the Data Pane.
- Drag the User Filter to the Filters shelf.
- Let’s say I want to further limit the student’s access to information so that they can only see their own scores. To do this, I will have to create another filter (User Filter 4) and map the student’s name in the User/Group Pane to their name in the Members Pane.
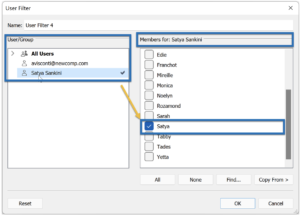
- After the filter is created and placed in the filter’s shelf, the view for Satya would now be like this:
- Once you publish the workbook, you want to make sure that the end-users can’t edit the filter and the workbook. To do so, set the permissions of the following options to “Deny”: Web Edit, Download Workbook/Data Source, Save As (for both workbook and data source), Set Permissions (of both).
As human beings, we tend to look for easy ways to finish up a task and optimize our work. With the help of automation, we can get rid of the most mundane tasks and focus on the important ones. Now, I want you to think about automating the filtering process that we just covered.
Create a dynamic filter using a security field in the data
You can create a calculated field that will automate the process of mapping the users to the values of the data. However, there’s a very specific requirement that must be fulfilled before you begin using your dynamic filter.
Here’s the catch: this method requires your underlying data to include the security information you want to use for filtering. The most common approach for this is using a reference table that contains the information that will be used for filtering.
Referring back to the classroom example that was used earlier, if you’d like to filter a view so that one user (let’s say a teacher) can see the information that is concerned with their profile (i.e., the subjects they teach at school), the underlying data must be set up to include usernames and specify each user’s role (i.e., student/teacher). This approach is more secure than mapping users to data values manually since the filtering is defined at the data level and is automated by the calculated field.
Let’s take look at this in action:
- In this example, we have math teacher Amelia and we want her to just have access to math scores when she looks at the workbook. Firstly, we must connect to the data source in Tableau. Here, I’ve connected to my excel file which has the scores and teachers sheets.

- I’ve joined the two sheets by left join on the Subject Field on the Data Source page.
- I start off by creating a calculated field where in I would define the following formula which would create a True/False field:
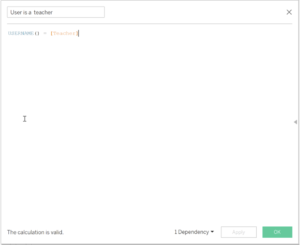
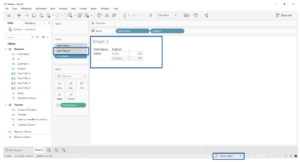
- This new true/false field appears in the Dimensions Pane. The formula returns TRUE if the username of the person appears in the Teacher Column. I then place my Calculated Field on the Filters Shelf and select TRUE in the Filter Dialog box and click OK and voila! See how the view looks to a particular person:
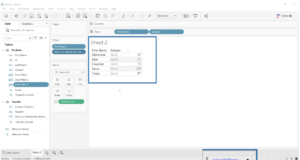
- In the lower-right, I opened the Filter as User Menu, and selected a name I know is a teacher (here, its Amelia and she can now only see the scores for Math).
By using a dynamic filter, you are actually limiting the amount of manual work you’d be doing otherwise (mapping each user to their respective member while configuring the filter). Just ensure you have a reference table with all the user roles defined and you can use that to create your user filter and place it on the filters shelf and see the magic happen.
I would love to hear your thoughts on this subject! Please shoot me an email at [email protected] and let’s talk all things data and Tableau!