
Robotic Process Automation For Data Science & Analytics
Unlock Data Sharing with Snowflake Data Marketplace
The Cloud for Analytics 101
“Disruption!”
“Digital Transformation!”
“Paradigm shift!”
A lot of buzzwords fly around in high tech. Software and services vendors love to use them, paired with scary statistics and confusing terms meant to create a sense of urgency strong enough to get you to take a sales call.
Before you take that call (yes, you still should, this stuff is critically important), I want to give you an agnostic but broad understanding of the cloud in the context of modern analytics and data science.
Let’s start with talking about how we got here in the first place – a little analytics history.
ANALYTICS 1.0
In the 1990s, basic desktop tools emerged for reporting and data discovery. This sparked interest in self-service business intelligence, and in the early 2000s the tools caught up, allowing users to build their own basic reports with no IT help. We built data warehouses to help with report performance, and over a few years, basic reporting applications evolved into powerful data visualization tools – let’s call this the era of Analytics 1.0.
At the same time, massive amounts of data were being generated and stored around the world. Analytics software vendors added proprietary data formats to their tools to help optimize performance, but that was a Band-Aid fix.
ANALYTICS 2.0
Luckily, something very important was happening behind the scenes. The Silicon Valley giants were inventing new ways to deal with their own “big data” problems and, thankfully, open-sourcing it for the general public to use.
This helped form the blueprint for managing big data, what we’ll call Analytics 2.0. Now we could manage semi- and unstructured data, using both streaming (real-time) and batch processing (scheduled on-demand). Databases that weren’t just rows and columns anymore, but also key-value stores, object stores and graphs.
But of course these open source platforms were built by (and for) Google, Amazon, Netflix and other tech beasts. They were expensive, required massive engineering and hardware efforts, and were not accessible to organizations of all sizes. We had a scale problem, not a technology problem. And that is where our story of Analytics 3.0 begins.
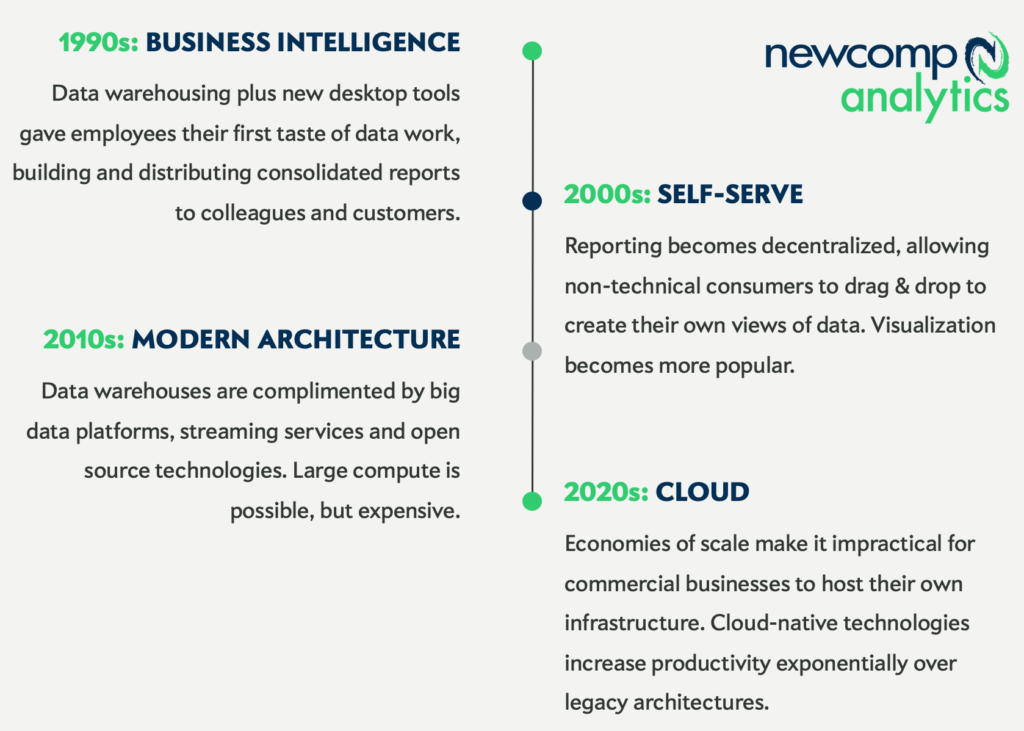
ANALYTICS 3.0: The Cloud
The natural evolution was for the tech giants, with their large data storage and computing infrastructure, to start offering these tools as a commercial service.
Need a petabyte-scale database?
Want to run an extremely complex optimization calculation?
Need to use a machine learning library for one day and then never again?
The massive investments the giants made in computing power allowed them to sell these services by the minute, or row, or instance – and still make massive profits. Finally, the world had a way to manage data and computing at all scales. And as Yoda famously said, “Begun, the Cloud War has.” Or something like that.
The cloud services difference
Cloud platforms provide a spectrum of abstracted services, with both bare-metal machines and software available to the public. These are offered as X-as-a-Service, with X being either Infrastructure, Platform or Software, illustrated here:
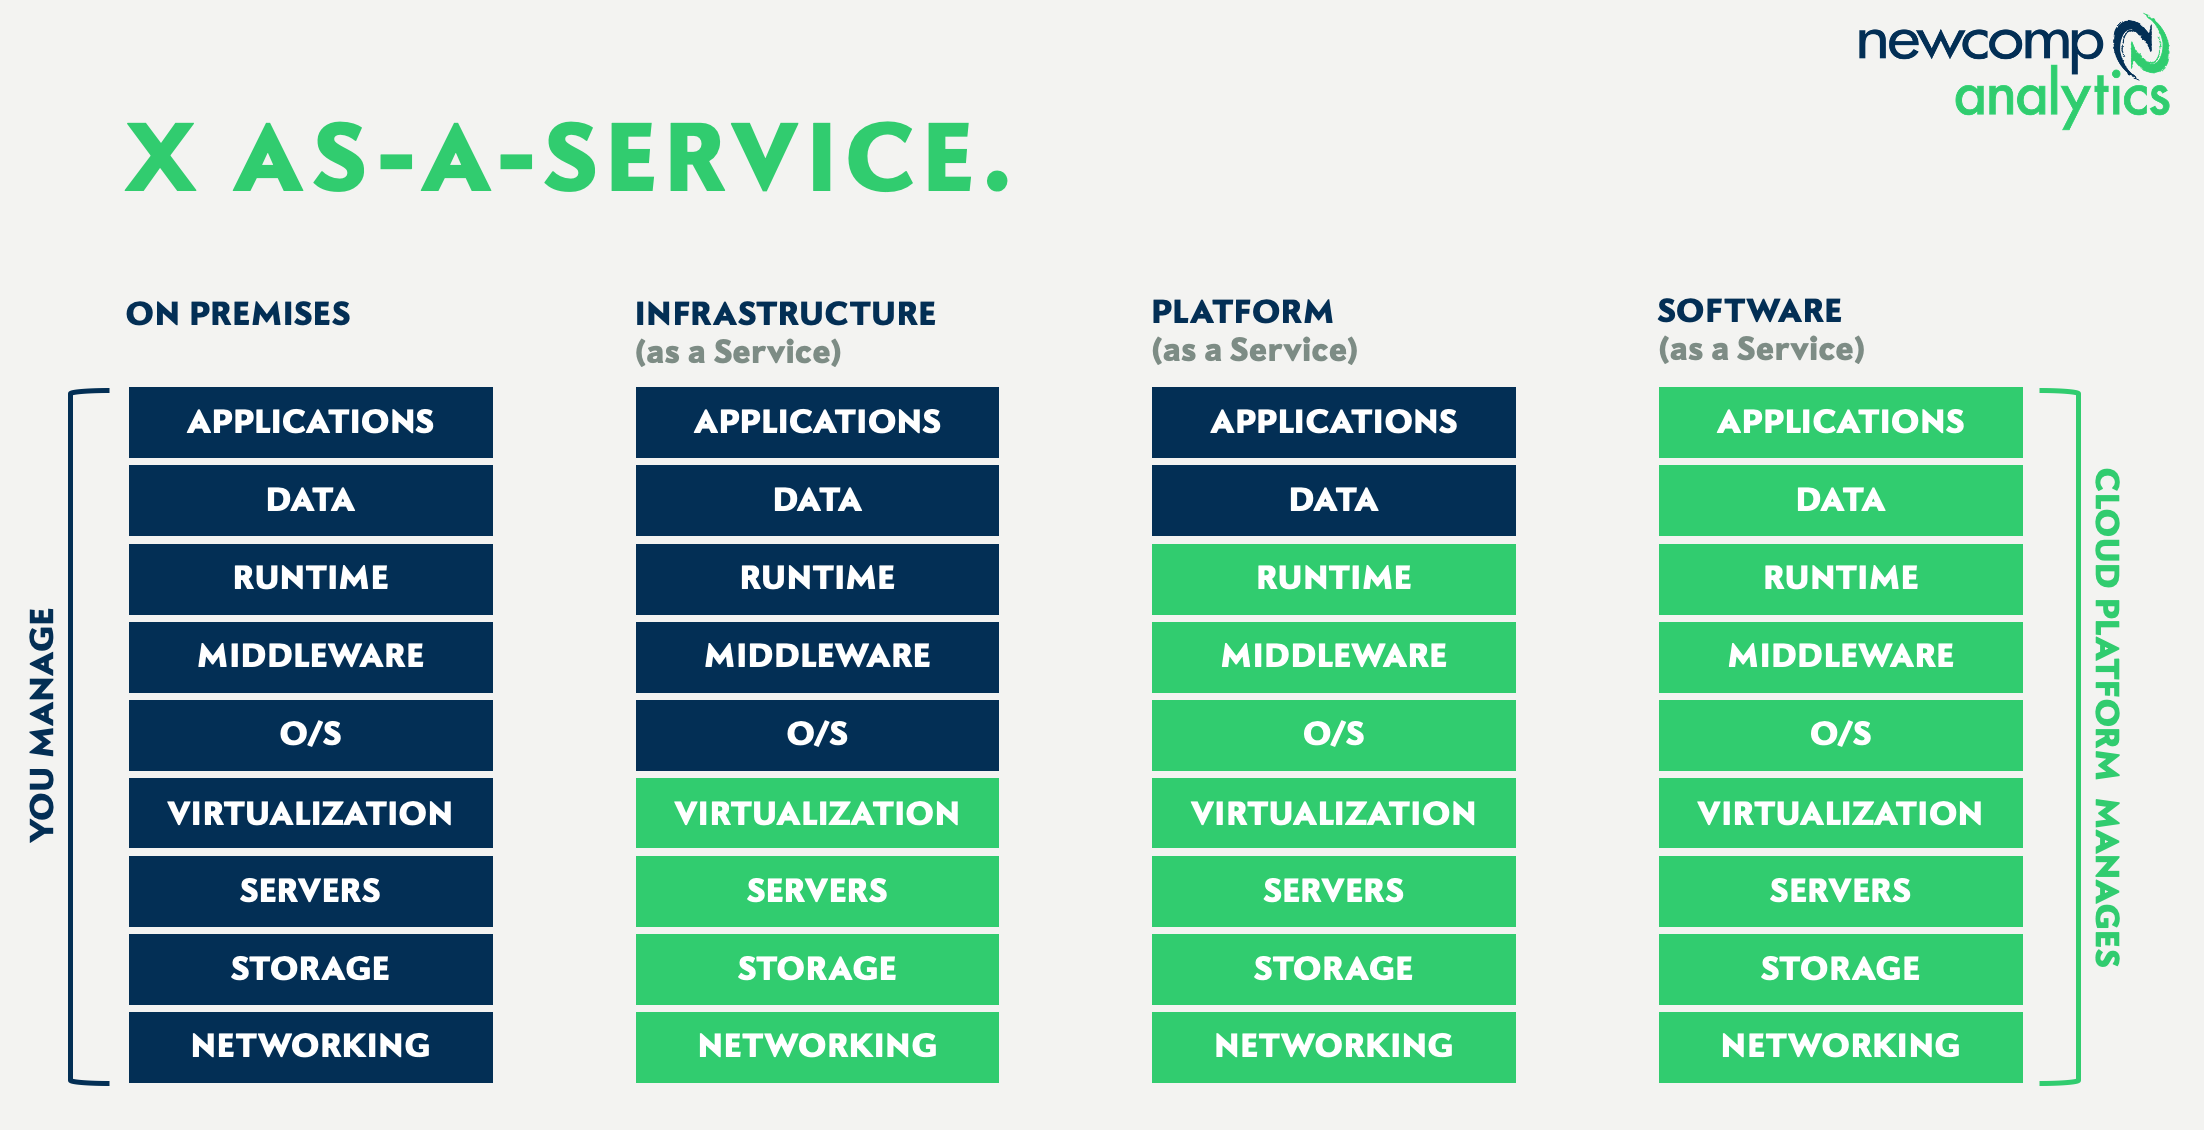
In the data analytics world, the services we need generally live on the right side of this diagram – either pure Software-as-a-Service (SaaS), or perhaps PaaS in some instances. This means the cloud vendor (AWS, Microsoft, Google et al.) is doing almost all of the IT work for us – hosting, backups, networking, tuning, monitoring, upgrades etc.
Once you decide on the design pattern appropriate for your analytics goals, you pick the services best suited for that architecture and begin your data pipeline design work.
In the analytics world, the goal is to design a supply chain for data. We are gathering that data from wherever it lives, organizing it and building appropriate high-performing structures to allow business and data science workers to consume and interpret it – as timely and formatted as they required. Now the real fun begins – it’s time to build.
Modern data architecture
Let’s oversimplify to start with. Assume we need to get data from on-premise sources (our ERP system, operational databases) and some external sources (a data subscription, public data like weather). Our data workers will use a variety of BI/reporting and analysis tools to interact with this data, once it is all consolidated and delivered in the various formats they need.
The capabilities we need to consider for our design are:
- Sourcing: A method to do real-time or scheduled data extraction from sources
- Distribution: Places to drop and organize our newly acquired raw data
- Packaging: The final presentation layer of the data for business use
- Shipping: An engine to move data along the pipeline
- Delivery: Interfaces for humans or machines to interpret or enrich data
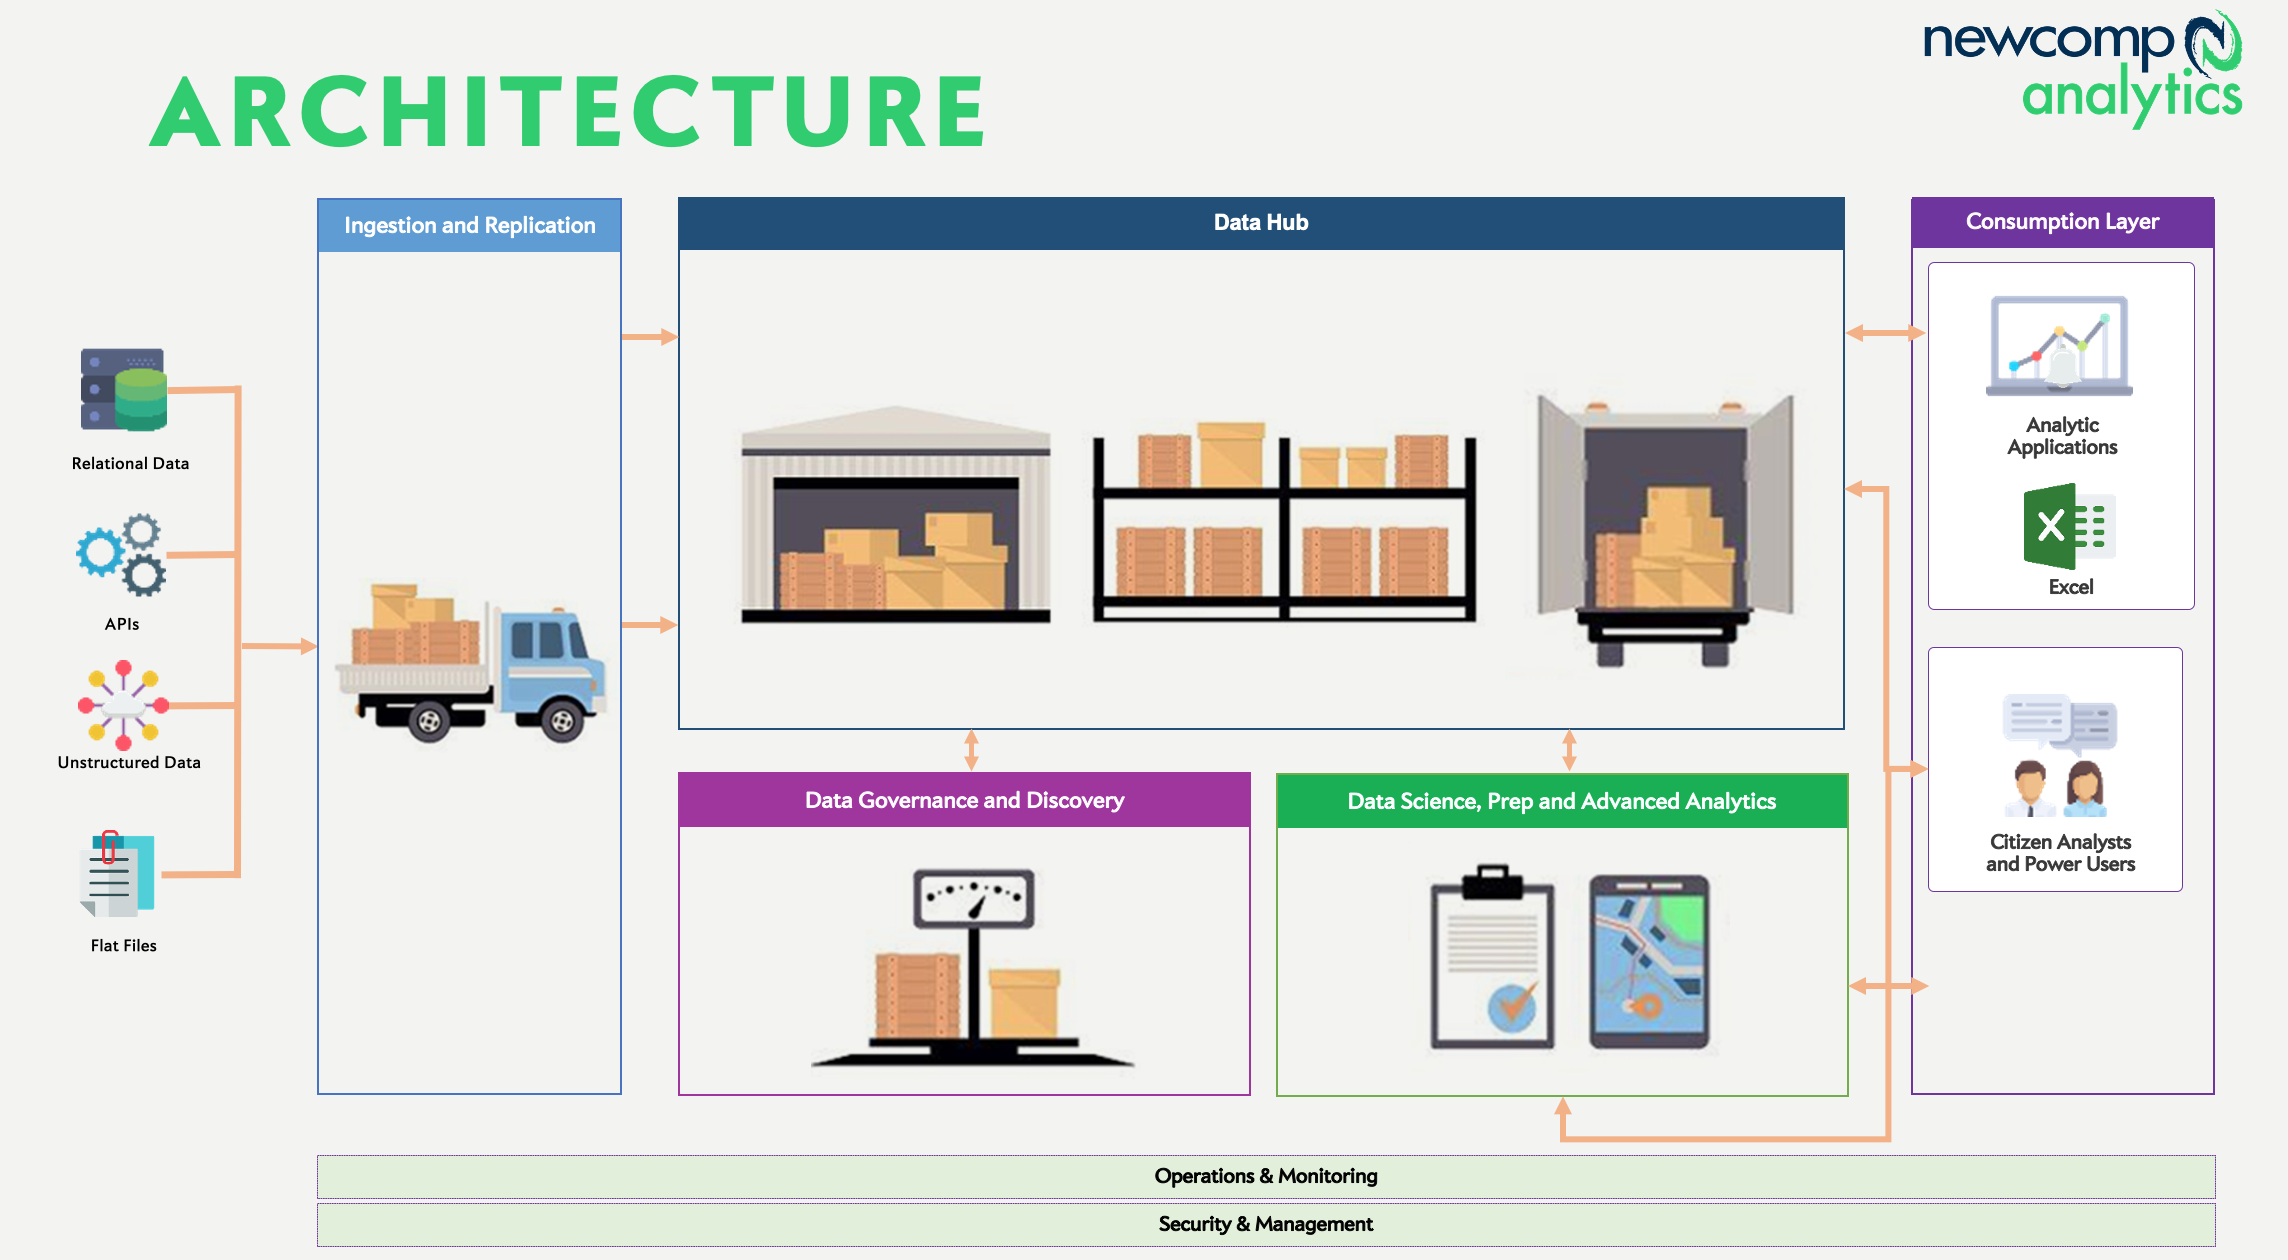
Let’s strip away the analogy now, and talk about the actual mechanisms that make up this data supply chain. To start with, let’s transpose the components of our supply chain onto a diagram of modern analytics architecture:
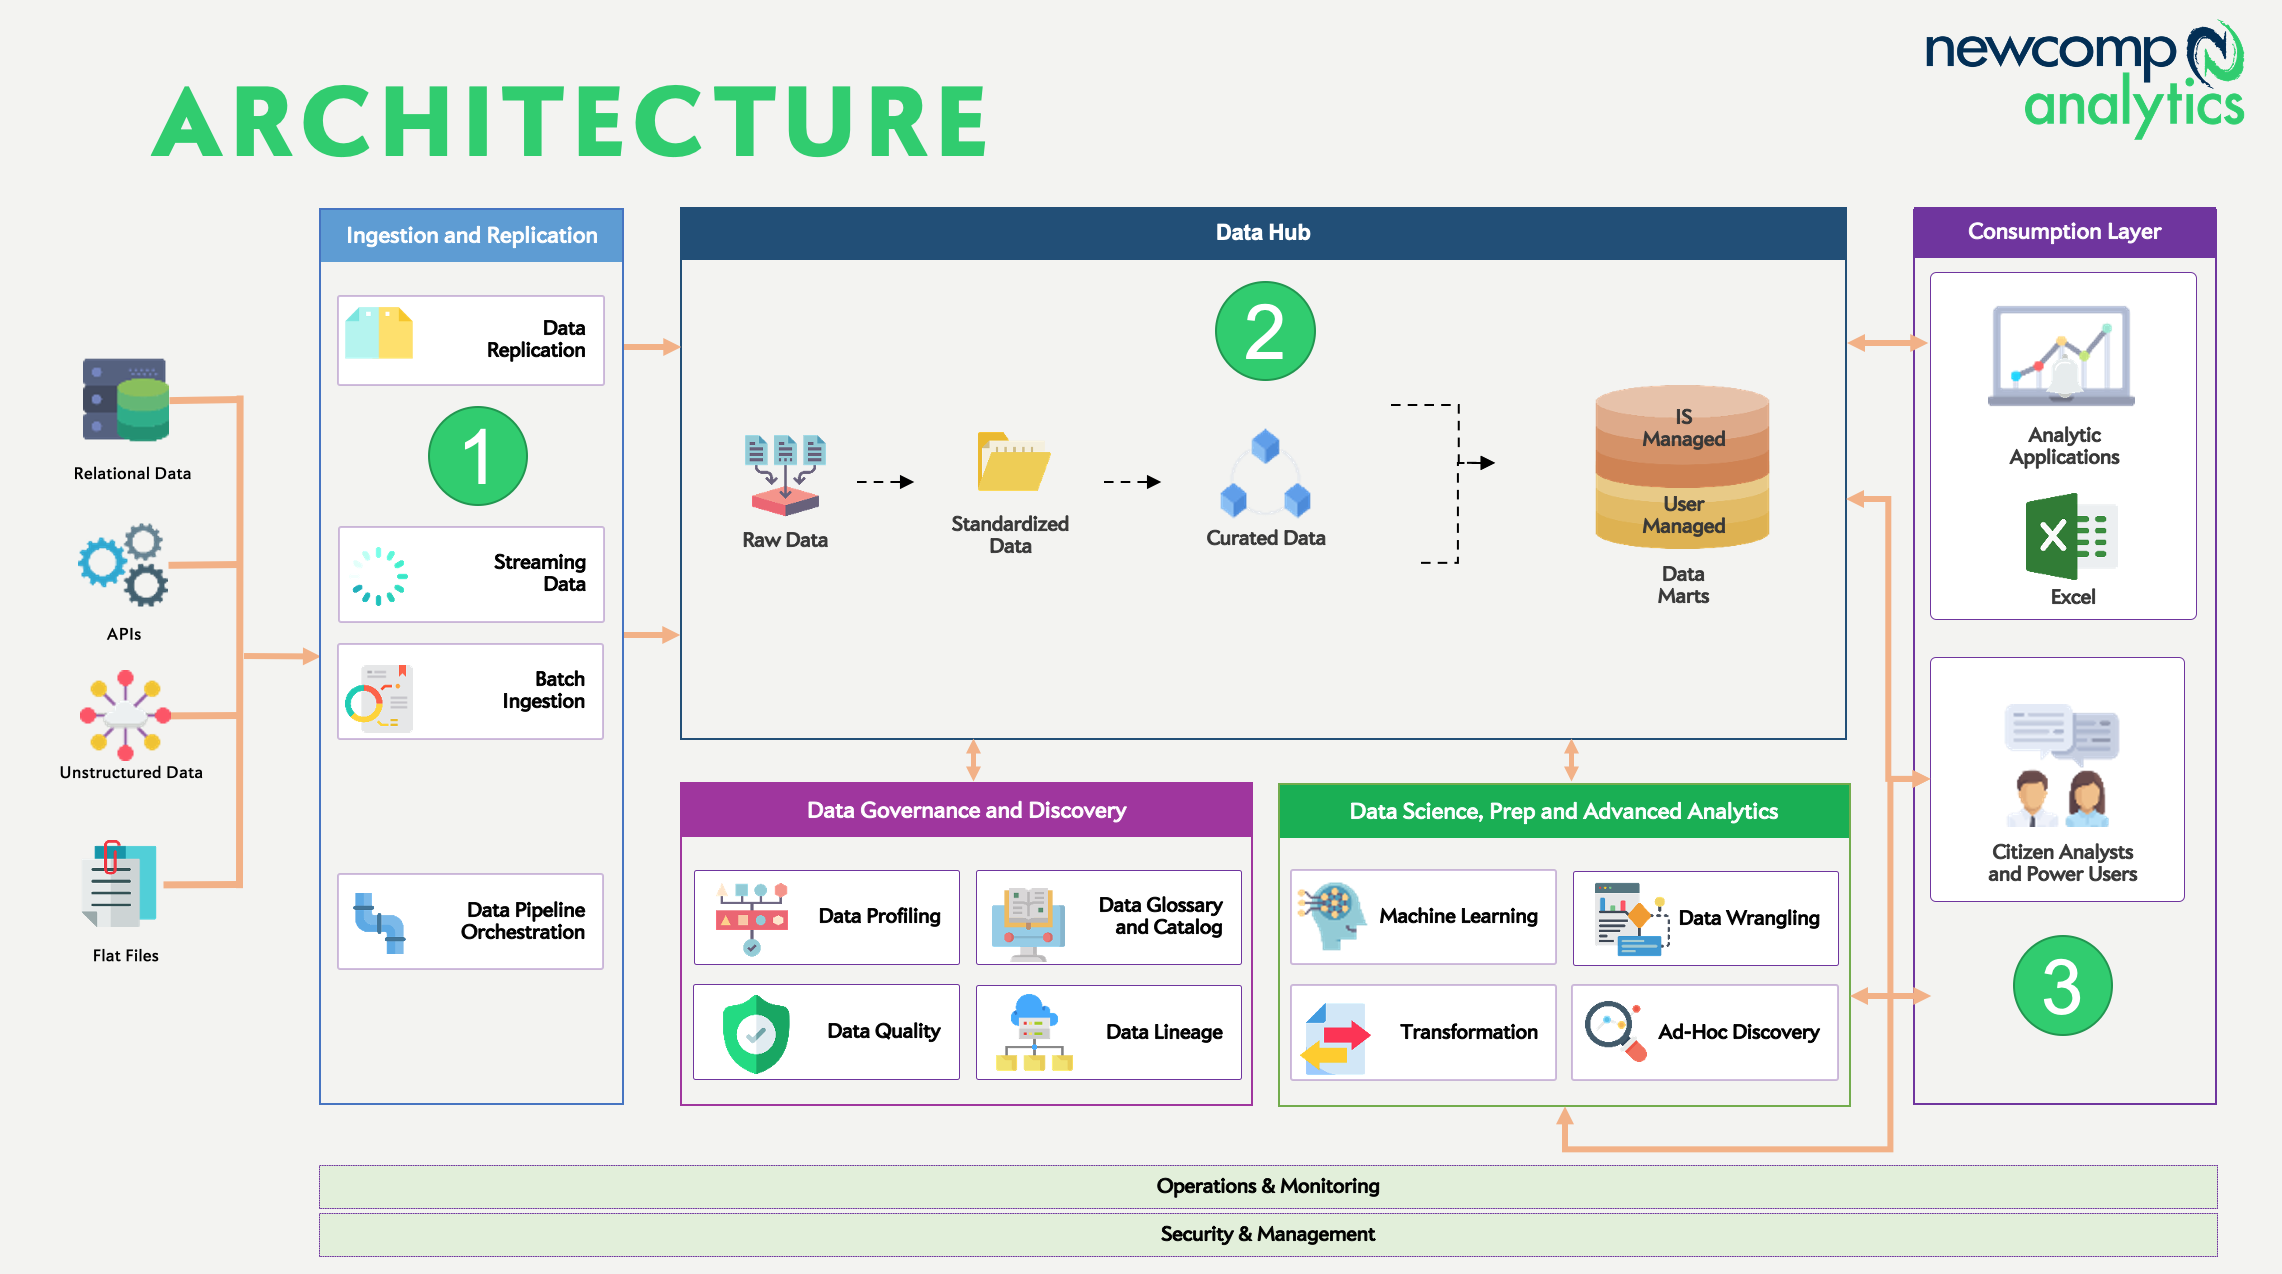
This diagram is still a little busy, but achieves something important. You can see how data flows from left to right as it is ingested and replicated(1), then landed and refined(2), then consumed(3).
Let’s map these concepts into an actual blueprint we could use to build that part of our pipeline.
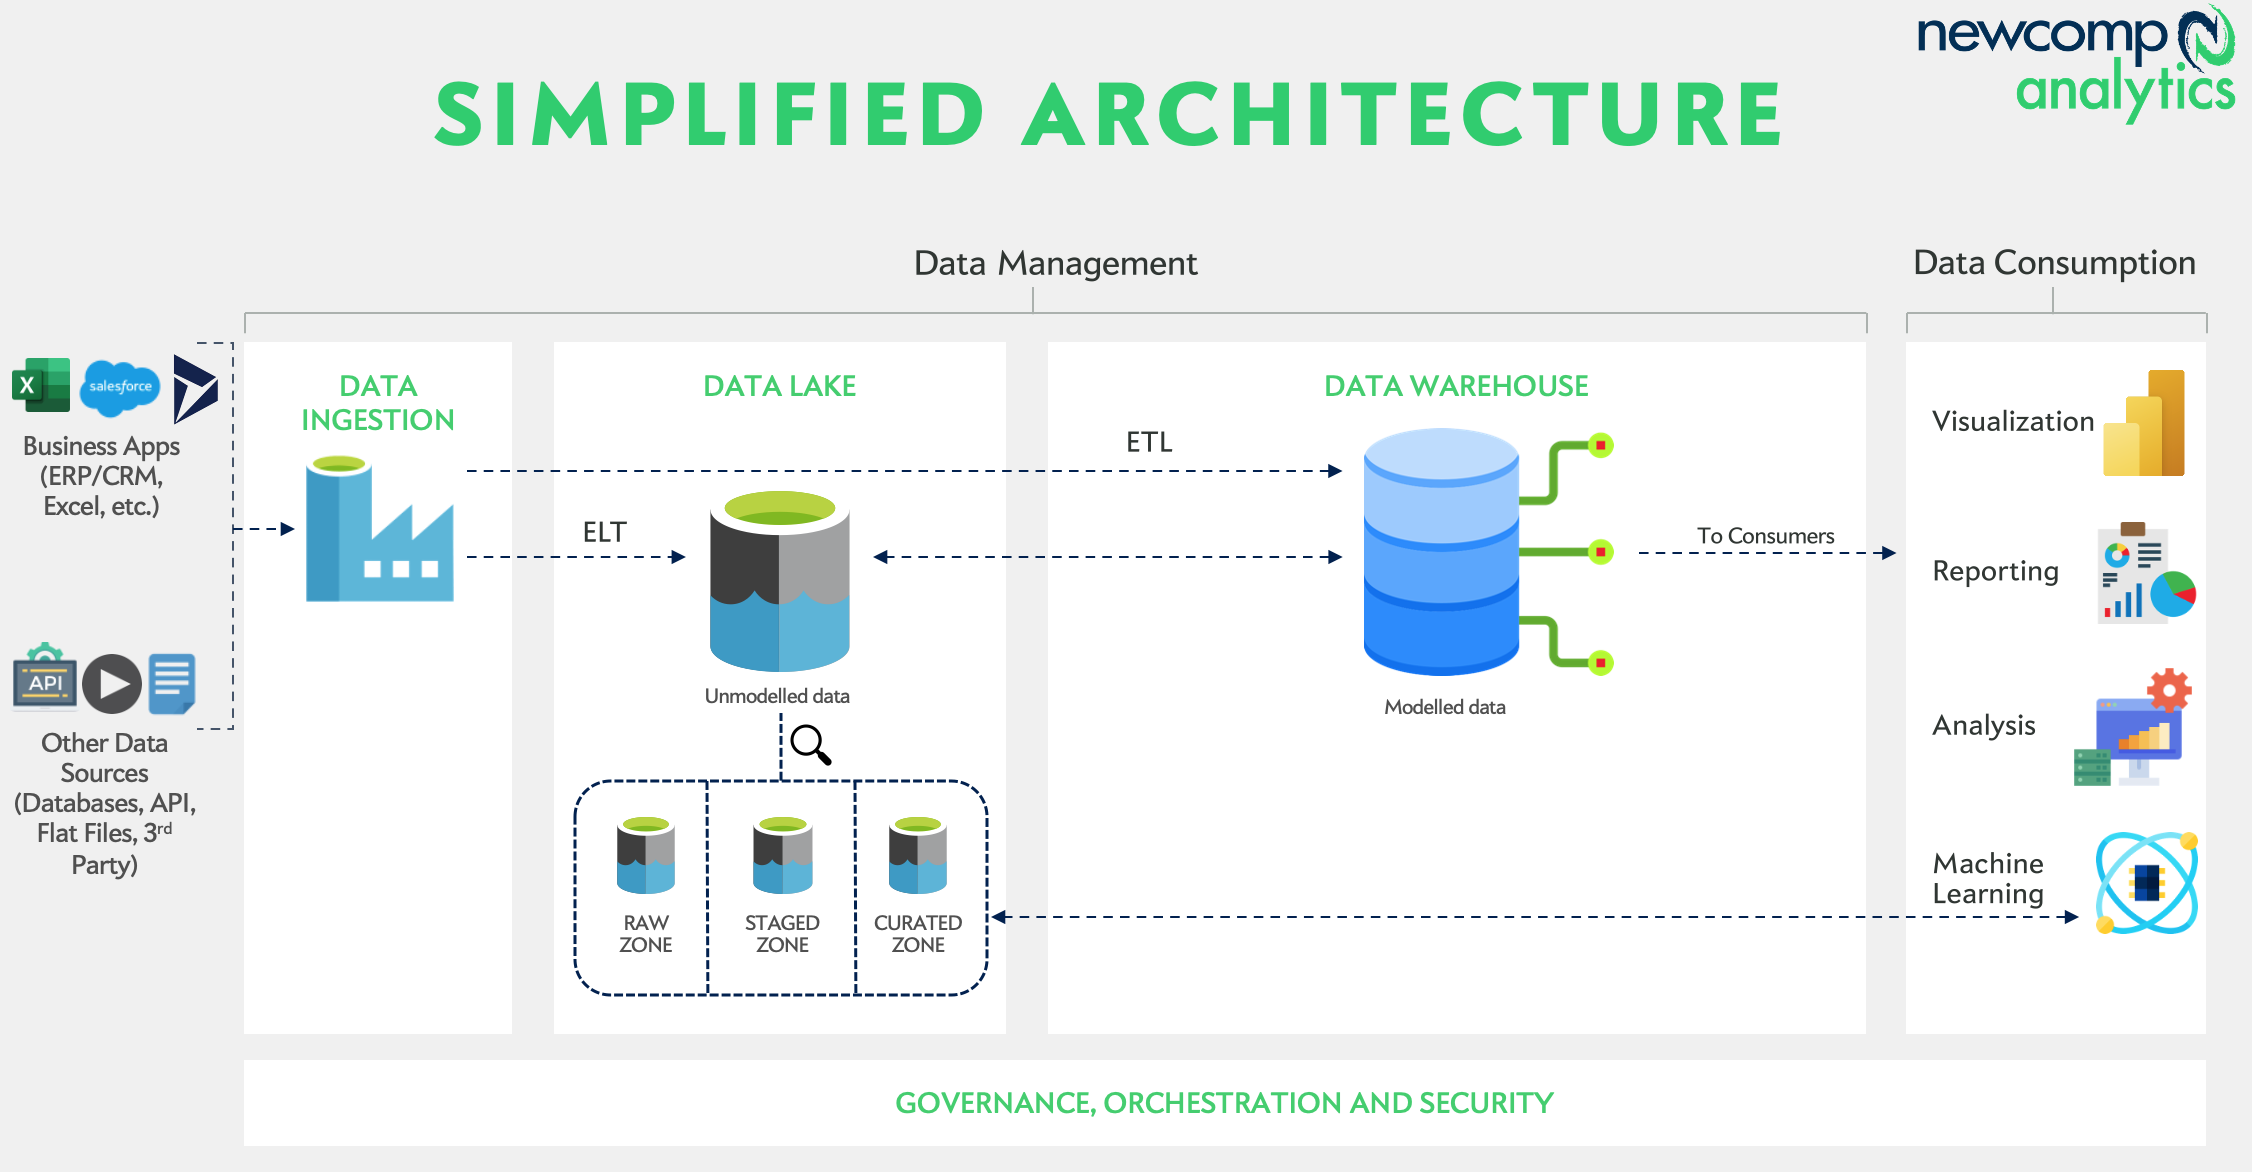
For those unfamiliar with the terms above, a quick summary:
Data Ingestion: Extraction and replication of data from sources, either scheduled or real-time
ETL/ELT: Extract, Transform and Load functions to move data from source to target
Data Lake: A storage zone for raw data, which is refined and prepared for consumption
Data Warehouse: Analytical query engine, serving results to models and data consumers
This series of services allows data to move from source to consumer. The cloud has a major impact on the deployment of these pipelines, from scalability to billing. We’ll talk more about this in a bit.
Data Architecture or Infrastructure? A blurry line
In the context of analytics, the cloud merges two historically separated domains – data management and IT infrastructure. Requirements and considerations for data delivery are now tightly coupled to the design of cloud services, which themselves are abstractions of IT infrastructure (servers, VMs, services, disk etc.).
Let’s be clear – you will need to rethink the way you design data solutions and manage data projects. These are not separate teams and departments anymore; in fact, agile development will be choked off and fail if cloud services are managed like legacy IT services and assets. Software- and Platforms-as-a-Service should reduce typical IT operational burdens enough to allow you to redeploy those experts to tuning and designing scalable cloud infrastructure.
Considerations for “seasoned” Analytics pros
There are a few key things to consider as you shift from Analytics 2.0 to the Cloud for data & analytics.
ELT vs ETL
Historically, data was moved using ETL – Extract from source, then Transform that data, then Load into a repository. Storage is so cheap now that we just extract all the data and store it before doing almost any transformations. This helps with refreshing, lineage, troubleshooting transformations, historical retention and much more.
Data lakes
These became popular for a few reasons. One is the shift to ELT, mentioned above. If we are moving all the data, we need a container to store and organize it. A data warehouse is not the place for this, it is designed for performant query computation – not cheap commodity storage. Second, we aren’t dealing with purely relational (i.e. rows and columns) data anymore. Images, PDFs, raw text, videos and other semi- and unstructured data now have a place in the analytics pipeline. The data lake is a file system that can not only store but support computation on unstructured data, like image recognition or audio translation.
Elasticity and pricing
Our risk-averse brains tend to favour predictability – and so do most corporate budgeting processes. So this will take some time to get used to. One of the biggest gains from cloud adoption is elasticity – that is, we get charged for what we use, and if we use more or less, the resources are automatically allocated and managed for us. No more building the church for Easter Sunday.
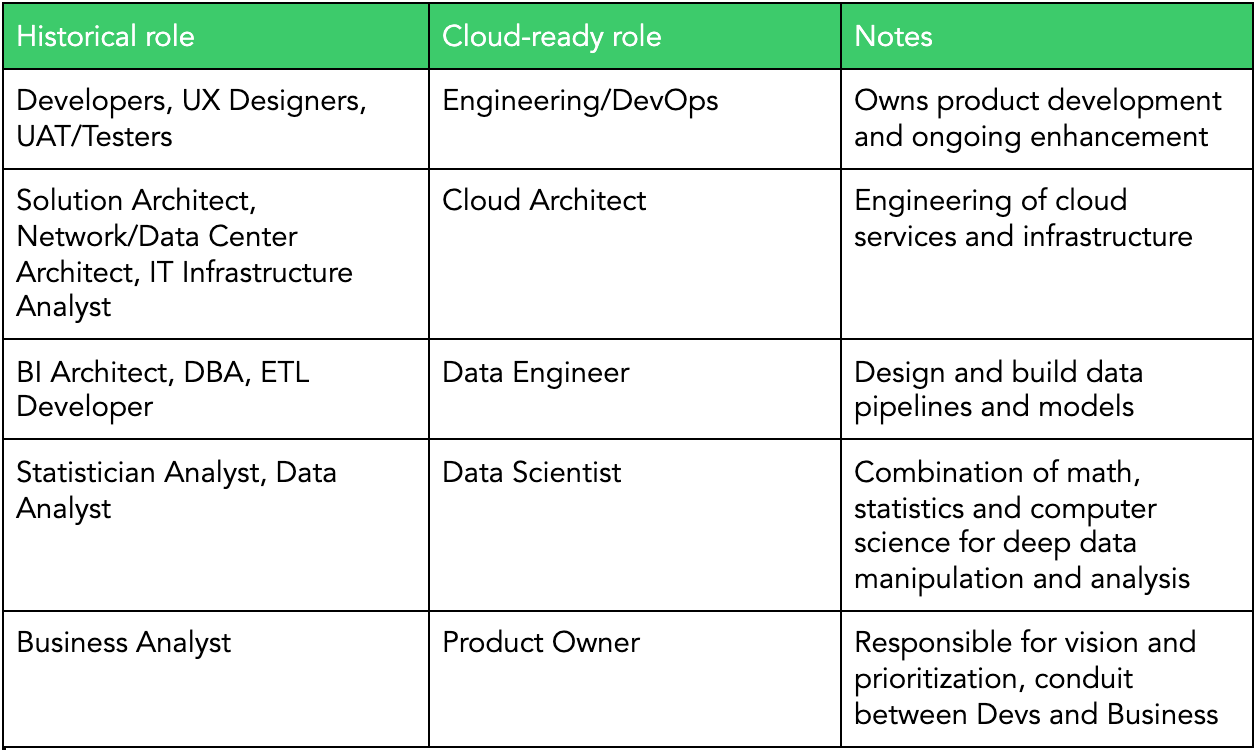
Skills for today and tomorrow
Big changes to technology trends mean schools and professional learning have to catch up. The good news is that we can use our existing Data and IT teams and their experience as we shift to a cloud-first strategy. Here are a few common mappings we see between legacy roles and the cloud jobs of the future:
Getting from A to B
Sure, it is easy to talk about cloud data utopia – but how do we actually get there? The cleanest, most successful migrations actually involve a number of carefully planned and measured steps. All the factors in this article have to be considered, and for most organizations those are too many moving parts to migrate in one big bang.
So, we aim to move very deliberately and with precision – and learn as we go. Maybe your skills aren’t ready to ensure industry security standards are enforced in the cloud; or, maybe you have no procurement model for cloud-based services spending or vendors. We see this all the time, especially in government and higher education.
Amazon (AWS) has a great way of framing migrations. They call it “The 6 Rs”, industry standard ways of thinking about methodologies for moving to the cloud.
Rehost: Also known as “lift and shift”
Replatform: Think of this as “lift, tinker and shift”
Repurchase: Time to buy a new product
Refactor/re-architect: Get creative and modernize architecture to be more cloud-native
Retire: Say goodbye to the app
Retain: Usually means we leave the app alone – at least for now
Let’s go together
Enough talk – let’s move something and start the ball rolling. Here are some ideas for you to take back to your team.
-
You get CSVs or other text files as raw data? Load these into data lake storage and build a simple SQL query to aggregate or computer some quantitative results – then visualize them live in a dashboard. (4 hours effort)
-
Users always wanted some real time data? Build a little event-driven replication engine from source to data lake. Then, write a little python script to visualize this data in a live graph. (Set aside 1 day for this)
-
Have a bunch of PDFs with interesting data like comments or narrative? Load them into a data lake, then use some simple APIs to convert the PDFs to text before writing a little python script to break down the comments into entities or sentiment scores. (Maybe a week of tinkering effort)
Let your imagination go wild now, there are very few limits to what we (as data engineers and scientists) can do with the cloud at our fingertips.
We hope you are inspired and feel more confident as you take on your cloud data adventures, please share your battle stories with us. That’s the best part of our job, taking what everyone learns and sharing it with the rest of the community.
Good luck!
To dive deeper into cloud analytics, join our upcoming Modern Analytics Architecture Bootcamp starting March 16th to learn how best to capture, transform and deliver insights to your organization with greater agility than ever before.
WRITTEN BY:
 |
CHRIS FOSTER, ANALYTICS PRACTICE LEAD
|
Chris Foster is responsible for spearheading the data science, AI and open source practice at Newcomp Analytics. Based in our Calgary office, Chris leads a team of analytics consultants on some of our more advanced analytics implementations. Chris isn’t afraid to roll up his sleeves, and is often found designing modern analytics architectures, developing machine learning models, and coaching executives in his analytics bootcamps.
Read more posts from our blog


