
IBM’s Cognos Analytics v11.0.5 includes many new and exciting features that will empower business users to create stunning reports with new visualizations and more capabilities than ever before. Cognos Analytics v11.0.5 is an upgrade from previous versions of Cognos Business Intelligence, meaning business users can simply upgrade from any version with all their assets, settings and configurations- and start using the new functionalities. With that in mind, let’s take a look at the top key features for the latest release of Cognos Analytics.
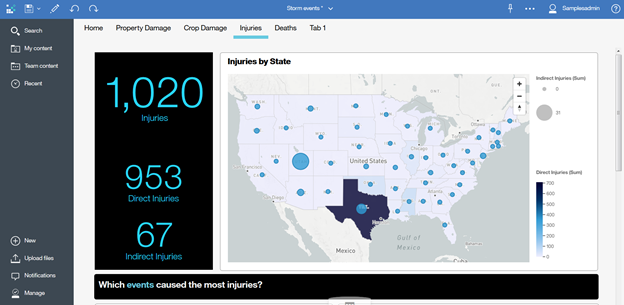
1. Geospatial Analytics
Business users now have access to mapping capabilities powered by MapBox, with worldwide base maps and street-level views, users can simply drag data items directly to their map and begin analyzing their data. This mapping software is ready to use with your upgrade and is just the beginning of the mapping capabilities in Cognos Analytics- stay tuned for upcoming releases.
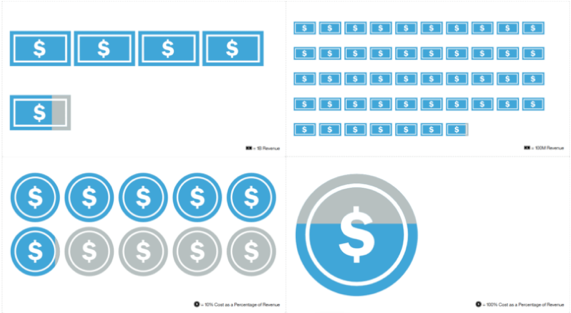
2. Storytelling
Storytelling was first introduced in the previous release (R4) and allows the business user to create a timeline to share their insights. In R5, Cognos Analytics now has instant infographic features where numeric values can be represented as images and shapes, along with text animations, and templates for guided journey navigation.
3. Dashboards
Several new features have been added to dashboarding to make it even easier to interact with your data. Some of the following features include:
- Pin Column Headers– When viewing your data in crosstabs or a grid, column headers such as the row and column are now pinned automatically for simpler viewing.
- Remove Filters– As you filter through visualizations you can easily select and remove filters.
- RAVE2 – Visualization engine for both dashboards and reports added for better performance, functionality, and appearance.Dashboard Visualizations Report Visualizations


- Navigation Paths- Allows greater flexibility to drill down into your data by jumping to different fields and levels.
- Access to Relational Framework Manager Packages- Users can now access FM packages from the dashboard itself, and drag and drop the data into the canvas.
4. Modeling
There are several modeling enhancements in this release such as:
- Navigation Groups- Data modules now contain navigation groups where users can create columns of different levels and fields and create different drill paths for their analysis.
- Schema Metadata Load Improvements- Metadata can now be cleared or re-read with a click of a button, as well as schemas can now be excluded by simply unchecking them so users have greater control over what information is made available in the data module.
- Linked Data Modules- Data modules can now be used as a data source or a reference to another data module- meaning no more redefining the same KPI calculations.
- Relational Package as Data Module Source- Framework Manager relational packages can now be used as a source to a data module and can be merged with other sources such as an uploaded excel spreadsheet which then can be joined and augmented together.
5. Reporting
Cognos Analytics includes new reporting visualizations that are ready to use in the upgrade, so users no longer need to download visualizations that they want to use. With the new visualization window users can now see a combined window of all the new charts available and filter through them.
For more information, and additional features for the latest release of Cognos Analytics check out IBM’s announcement here.
Enroll in our ‘What’s new in Cognos 11’ training course here
Stay tuned to find out how IBM will leverage these new features in the upcoming releases!


